AI Building Energy Optimization: How to Measure and Verify HVAC Energy Savings
AI-Driven HVAC Optimization With Verified Energy Savings
AI building energy optimization software should be evaluated not only by its optimization capabilities but by how it measures and verifies the resulting energy savings. A credible platform should establish a baseline, normalize for relevant conditions such as weather, continuously measure performance, and use an established M&V methodology.How do you know whether AI building energy optimization software is actually saving energy?
Key Takeaways
-
AI energy optimization should be evaluated by measurable building performance—not AI claims alone.
-
Measurement & Verification establishes a defensible way to quantify energy savings.
-
IPMVP/FEMP methodologies provide established approaches for measuring savings.
-
Options B and C can evaluate system-level and whole-building performance respectively.
-
Weather normalization is important when comparing energy use across different operating conditions.
-
EcoPilot's iBOS® Energy is purpose-built AI for HVAC optimization and integrates with existing BAS infrastructure.
This is one of the most important questions to ask when evaluating AI for building energy efficiency.
An AI platform may identify inefficiencies, recommend changes, or automatically optimize HVAC operation. But regardless of how sophisticated the technology is, building owners and energy managers ultimately need to know one thing:
Did the building actually use less energy as a result?
That is where Measurement & Verification (M&V) becomes essential.
For EcoPilot, energy optimization is not complete when the AI is installed. The performance needs to be measured against an appropriate baseline, adjusted for relevant conditions, and continuously evaluated.
EcoPilot's iBOS® Energy platform was designed around this principle: AI-driven HVAC optimization should produce measurable, verifiable energy performance.
What Is Measurement & Verification (M&V)?
Measurement & Verification is the process used to quantify and verify energy savings resulting from an energy efficiency project or operational change.
M&V establishes a defensible method for comparing a building's actual performance with the energy use that would have been expected under comparable conditions.
This is particularly important for HVAC optimization because building energy consumption is affected by many variables, including:
-
Outdoor temperature
-
Weather conditions
-
Building occupancy
-
Operating schedules
-
Internal heat gains
-
Building characteristics
-
HVAC operation
-
Changes in building use
Simply comparing this month's energy bill with last year's bill does not necessarily show how much energy an optimization system saved.
A credible M&V process accounts for the conditions that affect energy consumption.
The U.S. Department of Energy's Federal Energy Management Program (FEMP) describes four broad M&V approaches—Options A, B, C, and D—derived from the International Performance Measurement and Verification Protocol (IPMVP).
Why M&V Matters When Evaluating AI Building Energy Optimization Software
AI makes it possible to continuously analyze building conditions and optimize HVAC operation.
But AI capability and verified energy savings are two different things.
When evaluating an AI building energy optimization platform, ask:
-
How does the software establish a baseline?
-
What data does it use to measure performance?
-
How does it account for weather?
-
How does it account for changes in building operation?
-
Can savings be measured at the HVAC/system level?
-
Can savings be evaluated at the whole-building level?
-
Is the methodology based on an established M&V framework?
-
Can the results be independently reviewed?
These questions help distinguish an AI platform that produces energy insights from one that can demonstrate measurable operational results.
What Are the IPMVP M&V Options?
The IPMVP framework uses four broad approaches to measurement and verification.
The appropriate method depends on the project, measurement boundary, available data, expected savings, and required level of rigor. DOE's FEMP guidance describes them as follows:
Option A — Retrofit Isolation With Key Parameter Measurement
Option A focuses on an individual system or energy conservation measure (ECM).
Some parameters are measured while other factors may be stipulated or estimated through engineering analysis.
This approach can be appropriate when the key performance parameters can be reliably measured and the project does not require continuous measurement of every relevant variable.
Option B — Retrofit Isolation With All Parameter Measurement
Option B measures the relevant parameters affecting the energy use of the equipment or system being evaluated.
Measurements can be periodic or continuous.
For HVAC optimization, continuous system-level data can provide a detailed view of how the optimized system performs over time. DOE notes that continuous monitoring can support optimization and improve the performance of the retrofit.
Option C — Whole-Facility Measurement
Option C evaluates energy consumption for the entire building or facility.
Whole-building meter data can be analyzed using methods such as regression to account for variables including weather and operational changes.
This approach can be particularly useful when an energy efficiency project affects multiple systems or when the objective is to evaluate the overall impact on building energy consumption.
Option D — Calibrated Simulation
Option D uses a calibrated computer simulation model to estimate energy savings.
It can be appropriate for complex projects where calibrated modeling provides the required level of analysis.
The choice of M&V method should be based on the characteristics and risks of the project—not simply on which method is easiest to implement.
Which M&V Methods Does EcoPilot Support?
EcoPilot's iBOS® Energy platform supports M&V at both the system and whole-building level, corresponding to IPMVP Options B and C.
iBOS® can collect energy data from building meters and sub-meters through connected building systems and supported data interfaces.
This provides the data needed to evaluate both:
Option B: the performance of the affected systems, and
Option C: the overall energy performance of the building.
This distinction is important.
A system can demonstrate that an HVAC component is operating differently without demonstrating that the building as a whole is using less energy.
Conversely, whole-building savings can demonstrate an overall reduction without necessarily showing what happened at the individual system level.
Using both perspectives can provide a more complete understanding of performance.
How Does AI HVAC Optimization Actually Measure Energy Savings?
A credible savings analysis starts with a baseline.
The baseline represents how the building or system would be expected to perform without the optimization measure, under comparable operating and weather conditions.
Once the optimization system is operating, actual energy consumption can be compared with that normalized baseline.
The difference represents the estimated energy savings.
Conceptually:
Baseline Energy Use − Actual Energy Use = Estimated Energy Savings
However, the baseline must account for factors that influence energy consumption.
This is why simply comparing utility bills before and after an AI installation is not enough.
Why Weather Normalization Matters
Weather can have a major effect on building energy consumption.
A building may use substantially more energy during an unusually cold winter than during a mild winter—even if its HVAC system operates exactly the same way.
The reverse can occur during unusually warm periods.
Therefore, energy savings calculations need to account for weather conditions.
EcoPilot uses an Energy Signature approach to normalize energy data and evaluate building performance.
An Energy Signature models the relationship between building energy consumption and outdoor temperature.
This provides a way to distinguish between:
-
Energy use associated with temperature
-
Base energy loads
-
Changes in the building's heating or cooling behavior
-
Changes resulting from HVAC optimization
The result is a more meaningful comparison between baseline and post-optimization performance.
What Is an Energy Signature?
An Energy Signature is a model of how a building's energy consumption changes in relation to outdoor conditions, particularly temperature.
For HVAC-related projects, this relationship can be especially useful because heating and cooling loads are strongly influenced by outdoor temperature.
Rather than asking:
“Did this building use less energy this year?”
the analysis can ask:
“How much energy would this building have been expected to use under the actual conditions experienced, compared with how much it actually used?”
That is a much more useful question for measuring HVAC optimization.
How EcoPilot Establishes an Energy Baseline
The process begins with historical energy data.
Depending on the project, this can include:
-
Utility bills
-
Building automation system data
-
Meter data
-
Sub-meter data
-
Energy management system data
-
CSV or other historical datasets
The historical data is analyzed to establish the building's relationship between energy consumption and outdoor temperature.
The baseline can then be normalized using representative weather data.
EcoPilot can also compare local outdoor temperature measurements with nearby official weather data to account for differences between the building's actual microclimate and the nearest weather station.
This is important because two buildings in the same city can experience different localized conditions.
How Does EcoPilot Track Performance After Optimization?
Once iBOS® Energy is operating, actual energy consumption is continuously compared against established reference conditions.
The system can track:
-
Current energy consumption
-
Baseline energy consumption
-
Weather conditions
-
Temperature-dependent loads
-
Base loads
-
Building performance trends
-
Expected savings
-
Actual performance
This creates a continuously updated view of building performance.
Instead of producing a one-time calculation at the end of an energy project, the building develops an ongoing performance record.
What Does the Energy Signature Show?
An Energy Signature can include multiple reference lines.
For example:
Baseline: Expected energy consumption before optimization.
Current Trend: Actual energy consumption after optimization.
Target: A desired future energy performance level.
Comparing these trends makes it possible to see whether the building is performing above or below its established reference conditions.
For an AI HVAC optimization project, this can provide a transparent way to monitor whether the expected energy reduction is occurring over time.
Why Continuous Measurement Matters for AI HVAC Optimization
Traditional energy efficiency projects often involve a defined retrofit followed by periodic evaluation.
AI-based HVAC optimization is different.
The optimization system is continuously responding to changing building and environmental conditions.
That makes continuous data particularly valuable.
A building may experience:
-
A cold winter week
-
A sudden warm spell
-
Changes in occupancy
-
Changes in operating schedules
-
Equipment changes
-
Maintenance events
-
Seasonal transitions
Continuous measurement allows performance to be evaluated as these conditions change.
It also makes it possible to identify when building performance changes for reasons unrelated to the optimization system.
How Should You Evaluate the Energy Savings Claims of an AI Platform?
If you are evaluating AI building energy optimization software, don't stop at the vendor's percentage savings claim.
Ask to see the methodology.
A credible evaluation should address:
Baseline
What period and data were used to establish the baseline?
Normalization
How are weather and other relevant variables accounted for?
Measurement
What energy data is actually measured?
Measurement boundary
Are savings measured at the equipment, system, or whole-building level?
Persistence
Are savings monitored continuously after implementation?
Verification
Can the calculation be independently reviewed?
Uncertainty
How confident is the savings estimate, and what assumptions affect it?
DOE's current FEMP M&V guidance emphasizes that savings are estimated values and that the accuracy of the estimate depends on the quantity, duration, and quality of measurements.
That is an important principle when comparing AI optimization vendors.
Why Verified Savings Matter for Performance-Based Contracts
M&V becomes even more important when an AI energy optimization project is delivered through a performance-based contract.
In this model, compensation can be linked to achieved energy savings.
That creates a shared interest in having a clearly defined and transparent measurement methodology.
The building owner needs confidence that savings are real.
The technology provider needs a consistent method for calculating performance.
And both parties need to agree on how changes in weather, occupancy, operations, and other relevant factors will be treated.
DOE identifies M&V as an important mechanism for reducing uncertainty, allocating risk, and verifying savings in performance-based energy projects.
AI Optimization Is More Than an Energy Dashboard
There is an important distinction between energy analytics and energy optimization.
Analytics can tell you:
“Energy consumption increased.”
Advanced analytics can tell you:
“Energy consumption increased because of changes in operating conditions.”
Optimization adds another step:
“Given the current building conditions, how should the HVAC system operate differently?”
AI can then continuously apply that optimization strategy through the building's existing control infrastructure.
But even that is not the complete picture.
For building owners, the final question remains:
Did the optimization produce measurable savings?
That is why M&V should be considered part of the technology evaluation—not an afterthought.
What Makes EcoPilot Different?
EcoPilot's iBOS® Energy is purpose-built AI for HVAC optimization.
It is not a general-purpose chatbot, generative AI platform, or open-ended AI agent.
It is designed around a specific engineering problem:
How can an existing building's HVAC system continuously operate more efficiently while maintaining appropriate indoor conditions?
iBOS® Energy integrates with the existing Building Automation System and uses building-specific data to optimize HVAC operation.
The platform analyzes factors including building conditions, outdoor temperature, weather, occupancy-related conditions, and the building's thermal behavior.
EcoPilot describes iBOS® Energy as continuously recommissioning HVAC performance, with the platform recalculating optimization at regular intervals.
The optimization technology therefore sits alongside the existing BAS rather than requiring the BAS itself to be replaced.
Verified Results From Real Buildings
The value of an AI optimization platform ultimately needs to be demonstrated in operating buildings.
EcoPilot publishes project results from buildings where iBOS® Energy has been integrated with existing building automation systems.
For example, at Halifax Marriott Harbourfront, EcoPilot reports a 24.5% reduction in natural gas consumption and a 3% reduction in electricity consumption during the reported measurement period, representing a reported 13% reduction in total building energy consumption.
At Parkland at the Gardens, EcoPilot reports a 16% reduction in natural gas consumption and a 5% reduction in electricity consumption, while maintaining reported indoor temperatures within a 21–24°C range.
At Halifax's Maritime Centre, EcoPilot reports that between March 2024 and April 2025, the building achieved a 7% reduction in natural gas consumption, an 8% reduction in electricity consumption, and more than $110,000 in energy savings.
These project results illustrate why measurement matters: the performance of an AI optimization system should ultimately be evaluated using actual building data rather than AI claims alone.
Frequently Asked Questions About AI Building Energy Optimization
What is the best AI building energy optimization software?
There is no single software platform that is objectively best for every building. The appropriate solution depends on the building's HVAC systems, BAS, energy data, portfolio requirements, desired level of automation, and measurement and verification requirements.
For organizations evaluating AI-based HVAC optimization, important criteria include purpose-built HVAC optimization, BAS integration, continuous optimization, measurable energy savings, and a transparent M&V methodology.
EcoPilot's iBOS® Energy is purpose-built specifically for HVAC optimization and is designed to work alongside existing building automation systems.
How do you verify AI energy savings?
AI energy savings are verified through a Measurement & Verification process that establishes a baseline, measures actual energy consumption, accounts for relevant variables such as weather, and compares actual performance with normalized baseline conditions.
The appropriate methodology depends on the project. IPMVP-based approaches include Options A, B, C, and D.
Can AI HVAC optimization savings be measured at the whole-building level?
Yes. Whole-building measurement corresponds to IPMVP Option C. It uses facility-level energy consumption and can incorporate statistical methods to account for variables such as weather and operational changes.
Can AI HVAC optimization savings be measured at the system level?
Yes. IPMVP Option B uses measurements of relevant parameters at the equipment or system level. This can be useful when the objective is to evaluate the performance of a particular HVAC system or energy conservation measure.
Does EcoPilot replace the building automation system?
No. iBOS® Energy is designed to integrate with and optimize an existing BAS rather than replace it. The BAS remains the underlying building control infrastructure while iBOS® provides an optimization layer.
Why is weather normalization important when measuring energy savings?
Weather affects heating and cooling demand. Normalizing energy consumption for weather makes it possible to compare building performance under different environmental conditions and create a more meaningful estimate of energy savings.
What is an Energy Signature?
An Energy Signature models the relationship between a building's energy consumption and relevant environmental conditions, particularly outdoor temperature. It can be used to establish a baseline and evaluate changes in building energy performance.
The Bottom Line: AI Energy Optimization Should Be Measurable
AI can make HVAC systems more responsive, predictive, and efficient.
But the technology itself is not the result.
The result is measurable improvement in building performance.
When evaluating AI building energy optimization software, look beyond claims about artificial intelligence and ask:
What is the AI actually optimizing? Does it integrate with the existing BAS? Does it continuously respond to building conditions? How are savings measured? What M&V methodology is used?
Can the results be verified? Can the methodology scale across a portfolio?
For EcoPilot, Measurement & Verification is an integral part of the approach to AI-powered HVAC optimization.
iBOS® Energy combines purpose-built AI, existing building automation infrastructure, continuous HVAC optimization, and data-driven measurement to help building owners understand not only how their buildings are performing, but how much energy the optimization is actually saving.
Learn More About AI-Powered HVAC Optimization
Explore EcoPilot iBOS® Energy →
Explore EcoPilot's Building Energy Optimization Resources →
Talk to EcoPilot About Your Building →
********************************************************
AI-Driven HVAC Optimization with Verified Energy Savings
In all projects including Energy Conservation Measurements (ECM) it’s important to be able verify the savings. This is done through Measurement & Verification (M&V) where the International Performance Measurement and Verification Protocol (IPMVP) have defined one of the most widely followed best practices in the field.
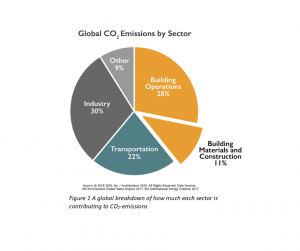
The strive to combat climate change and to meet the goals of the Paris climate agreement have put energy efficiency higher and higher on the agenda for many companies and government agencies across the world. In the western countries, buildings and their associated energy consumption make up about 40% of all greenhouse gas emissions which means that their improvement is going to play an important role in meeting these goals.
 With increased energy prices, transmission costs and taxes comes a financial incentive to do this and it’s not uncommon that companies can save 20-40% of their HVAC’s energy consumption through the implementation of modern equipment and smarter control strategies with iBOS®.
A common way to make such improvements are through Performance-Based Contracts where a company promises to deliver at least a certain amount of savings either with an up-front cost or with the company charging what they’ve saved for a fixed number of years. Such an approach can minimize the risks for the building owner or building management company, but also requires a well thought out method for Measurement & Verification of energy savings that both parties can agree upon. Here we describe Measurement & Verification in general and how iBOS® is following the established industry-standard.
The U.S. Department of Energy’s Federal Energy Management Program’s (FEMP) guidelines for measurement and verification describe four different Options (A-D) of determining the energy savings from energy efficient equipment, water conservation, improved operation and maintenance, renewable energy, and cogeneration projects. These Options have previously been defined as best practices by the International Performance Measurement and Verification Protocol (IPMVP) and are widely recognized by different government agencies across the world. While IPMVP have defined a number of options that should be used for Measurement & Verification, they have not made a step by step instruction of how the actual process should be carried out. This decision still remains in the hands of the energy auditor as IPMVP recognize that each project will have its’ own possibilities and challenges.
The Options described by IPMVP as best practice are:
-
Partially Measured
-
Retrofit Isolation
-
Whole Facility
-
Calibrated Simulation
The different Options are explained in Table 1 below:
|
IPMVP Option |
Supported by iBOS® |
|
A. The energy performance of the system to which ECM was applied is measured over a shorter period of time, usually using temporary measurement devices. The results are then extrapolated to calculate what the annual energy consumption of the component should be. This approach is most commonly used for smaller components such as pumps and fans. |
No |
|
B. Here the energy performance of the system to which ECM was applied is measured over a longer period of time or continuously. This Option is usually more expensive but has become more readily available over the last few years due to sub metering becoming a standard in new installations and because more expensive pressure modulated pumps and EC-fans may have integrated energy meters that can be connected to the Building Management System (BMS) |
Yes |
|
C. Here the energy usage is measured for the whole facility. The easiest way of doing this is by looking at the bills for gas, district heating, water and electricity but most modern meters also have the ability to report its’ consumption in real time through an interface like Modbus, BACnet, M-bus, pulse, etc. By comparing the energy usage before and after the ECM, one can see how the change has affected the overall consumption of the media. This Option is best used when major refurbishments have been done, such as the installation of a new boiler or when the control strategy for the building is being changed |
Yes |
|
D. A calibrated simulation means that no actual measurements are made on components or the building itself. Instead a simulation model is created which is supposed to show how the component, system or building would behave during a normal year. This is then compared to the pre-ECM behavior to estimate what the savings should be like. This approach is best used for simple applications such as when ordinary lights are changed to LED. In cases like this, the energy savings can be easily derived from the difference in specifications. For larger application this approach usually requires substantial knowledge about computer modeling as well as specialized software to run the simulations. |
No |
iBOS® connects to all of the available main- and sub-meters in a building to gather its’ energy data. The data can be gathered from any source that supports BACNet, Modbus or JSON-RPC which means that the source could be both a BMS, a gateway or the meter itself. All of this means that iBOS® is compliant with IPMVP’s standards for both Option B and Option C when it comes to Measurement & Verification.
Energy Signature – The most reliable way to do normal year correction of energy data
iBOS® uses the Energy Signature method for normalization and verification of savings which has several advantages over other common methods such as Degree Day Compensation. CIT Energy Management AB have compared different methods of normalizing energy data and they found that the Energy Signature gave the most accurate monthly compensation over a range of building types and weather conditions. Their study is backed by another paper published by The Swedish Energy Agency. Together they’ve identified the following advantages with the Energy Signature method:
-
The Energy Signature method can be used with any building regardless of its’ balance point temperature. Degree Days are usually generated for a model building with a high balance point temperature and the more the model differs from the actual building, the more error you’re going to get when you normalize your energy data.
-
The Energy Signature method uses the local weather for its’ calculations which may differ significantly from the nearest weather station, especially in crowded cities.
-
The Energy Signature method allows you to compare buildings that are situated in different cities or even countries, regardless of what the annual average temperature is on site. This means that you can objectively compare buildings to one another to determine which has the best fabric or system setup. An example of how the temperature may differ in different parts of a country can be seen in Figure 2.
More and more professionals are starting to use the Energy Signature method and it is used by both energy consultants, researchers, government agencies and energy companies for normal-year correction of energy data and load prediction.
Below is a description of the methodology used by iBOS® in creating an Energy Signature for measurement and verification.
 Acquiring Baseline Data
To create the baseline of a building or a system in an iBOS® project, monthly non normalized energy data from a reference year is required. Data from logs in the BMS or other 3rd party system as well as CSV- or other data-files, monthly bills etc. can all be used for this. The data is preferred to be based on calendar months but if there are overlaps it can still be used with the help of analysis software and extrapolation techniques.
Determining and normalizing the Baseline
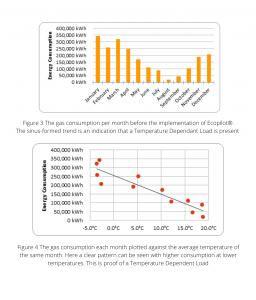
The next step in the process is to determine whether the measured systems have a Temperature Dependent Load or not. This is done by analyzing the energy consumption data looking for differences in consumption based on time of year and average temperatures. An example of what that may look like is shown in Figure 3 and Figure 4 .
Next, the Base Load and the Temperature Dependent Load are calculated using the reference year’s average temperature and entered to form a baseline of comparison in the Energy Signature. By entering the normal annual average temperature for the location as recorded by the country’s national weather institute this baseline is now corrected to reflect the energy consumption as it would be in a normal year.
Calibration of the Energy Signature
When we have a full month of readings from an outdoor temperature sensor that is unaffected by sunshine, we can compare that sensor’s average reading to the closest official weather station to compensate for the micro-climate that this specific building is experiencing.
Adding additional Reference Lines 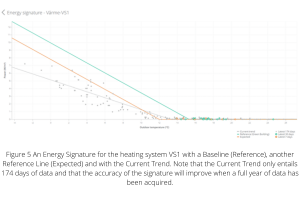 With iBOS® controlling the building we expect a significant reduction in energy usage. In the heating case however, the Base Load won’t change, nor will the buildings’ thermal performance (it’s Temperature Dependent Load) so what we will affect with iBOS® is the building’s Balance Point Temperature, meaning in this case the outdoor temperature when the heating system needs to turn on. By using a smarter control strategy and by using the available free heat that we get from internal loads and sunny weather we can delay when we need to turn the heating system on, thus saving energy. Our savings estimates are experience based and by trying new Balance Point Temperatures we will eventually end up with another reference line that represents the savings that we expect to see. This is something that can be added to the Energy Signature as an additional reference line (see Figure 3). Other things that one might want to visualize are future energy goals for the building and past outcomes at the end of each year. Since iBOS® doesn’t have any restrictions of how many reference lines you can have, the Energy Signature can easily be modified to give you the statistics that you’re looking for right now.
Comparing the buildings’ current performance to the Reference Lines
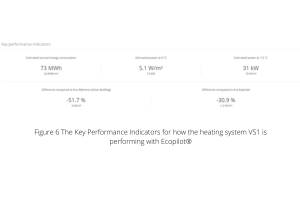 At the end of each day we will plot the daily mean specific power usage together with these reference lines and in time we will end up with an energy pattern of our own, namely the Current Trend which can also be seen in Figure 3. By comparing this trendline to our reference lines we can easily determine how large the savings are. This information together with some other calculated performance indicators make up our Key Performance Indicators seen in Figure 4. All of these indicators are relevant when comparing different buildings to one another and together they give you a good understanding of how well the buildings are performing. The actual energy usage is also saved in tables for future reference or for analysis by a 3rd party.
Conclusion
iBOS® complies with IPMVP’s Option B and Option C regarding Measurement & Verification. The iBOS® software uses the Energy Signature method to normalize energy data and to calculate the achieved energy savings. The benefits of the Energy Signature method are that accurate savings and load estimate calculations can be made for buildings with different balance point temperatures situated in different climate zones while considerations are made to every building’s unique micro-climate.